
Technical Analysis
Stage 2: Direct your investments with technical analysis
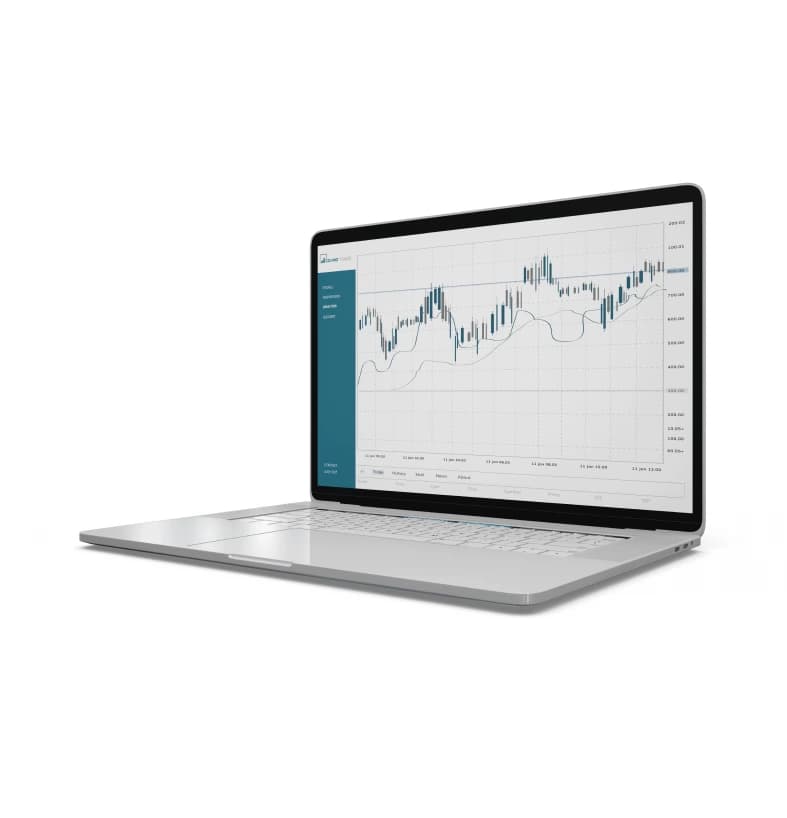
Technical Analysis
Simple analyze tools and classic methods
Master the art of reading price charts and using technical indicators. Learn to identify trends, support/resistance levels, and generate reliable buy/sell signals through chart analysis.
What is Technical Analysis?
Technical analysis is the study of past price movements to forecast future price direction. Unlike fundamental analysis, technical analysis focuses purely on price action and volume data, using charts and mathematical indicators to identify trading opportunities.
The core principle is that all known information is already reflected in the price, and that price patterns tend to repeat due to market psychology. By studying these patterns, traders can anticipate future movements.
For example, when a currency pair repeatedly fails to close above a specific price level, that level becomes a visible resistance zone on the chart. Combined with declining volume on each attempt, this pattern often signals that buying pressure is running out — information technical analysis extracts directly from price action, without needing to know why the underlying economic story is unfolding.
Key Topics You'll Learn
Master chart reading and indicator analysis
Chart Types & Patterns
Master candlestick, bar, and line charts with common price patterns.
Support & Resistance
Identify key price levels where markets tend to reverse or consolidate.
Trend Analysis
Recognize uptrends, downtrends, and sideways markets effectively.
Moving Averages
Use SMA, EMA, and other moving averages for trend confirmation.
RSI & MACD
Apply momentum indicators to identify overbought/oversold conditions.
Fibonacci Tools
Use retracement and extension levels for price targets.
Practical Application
How to apply technical analysis in trading
Entry Points
Learn to identify optimal entry points using technical signals.
Exit Strategies
Set profit targets and stop-loss levels based on technical analysis.
Risk Management
Calculate position sizes based on chart-based risk assessment.
Multi-Timeframe
Analyze markets across different timeframes for confirmation.
Essential Chart Types
Candlestick Charts
Most popular chart type showing open, high, low, close prices with visual patterns.
Bar Charts
OHLC data displayed as vertical bars with horizontal ticks for open/close.
Line Charts
Simple closing price connection, ideal for identifying overall trends.
Common Mistakes at This Stage
Stacking indicators that measure the same thing
RSI, Stochastic, and CCI are all momentum oscillators — using all three rarely adds new information, it just triples the same signal and creates a false sense of confirmation.
Trading against the higher timeframe trend
A clean bullish setup on the M15 chart is far riskier if the H4 or Daily chart is in a clear downtrend. Always check at least one timeframe above the one you trade.
Entering before a pattern actually completes
A head and shoulders pattern isn't confirmed until the neckline breaks. Anticipating the break instead of waiting for it is one of the most common ways traders get caught in a false move.
Redrawing support and resistance after the fact
Moving a support line to fit where price bounced, instead of where you originally drew it, teaches you nothing and inflates your confidence in a level that wasn't really there.
Quick Self-Check
Before moving on to Stage 3, see how many of these you can honestly check off.
- I can explain why I chose my current indicators without just saying "they work."
- I check at least one higher timeframe before taking a trade on my main chart.
- I can point to the exact candle or level that would prove my chart pattern wrong.
- I mark my support and resistance levels before price reaches them, not after.
Frequently Asked Questions
Which timeframe is best for technical analysis?
There is no universally "best" timeframe — it depends on your trading style. Scalpers typically use M1-M5 charts, day traders use M15-H1, swing traders use H4-D1, and position traders rely on W1-MN charts. Many traders confirm signals across multiple timeframes before entering a trade.
Do I need advanced math skills to use technical indicators?
No. While indicators like RSI and MACD are built on mathematical formulas, trading platforms calculate them automatically. What matters is understanding what each indicator signals and how to interpret it alongside price action.
Can technical analysis be used without fundamental analysis?
Yes, many traders rely primarily on technical analysis, especially for shorter-term trades. That said, being aware of major fundamental events, like central bank announcements, helps avoid being caught off guard by volatility that technical patterns alone would not predict.
How many indicators should I use at once?
Using too many indicators can lead to conflicting signals and analysis paralysis. Most experienced traders limit themselves to two or three complementary indicators — for example, a trend indicator like a moving average alongside a momentum indicator like RSI.
Why did a chart pattern fail even though it looked textbook-perfect?
No pattern has a 100% success rate — reliability figures describe probabilities, not guarantees. A pattern is also more likely to fail without volume confirmation, when it forms against the higher-timeframe trend, or when a fundamental catalyst (like a surprise data release) overrides the technical setup entirely.
What is the difference between a lagging and a leading indicator?
Lagging indicators, like moving averages and MACD, confirm a trend after it has already started, which reduces false signals but delays entries. Leading indicators, like RSI and Stochastic, attempt to signal a reversal before it fully plays out, offering earlier entries at the cost of more false signals.